 InfoSol We're passionate about inspired business intelligence
Related Articles



We have seen various ways to create reports like Top 10 Customers by Sales, Top 10 Cities by population, Top 5 countries by profit Margin etc. It’s usually Top N by a <Measure>. What if there’s a requirement Top N by a <Date> or Most Recent N by a <Date>? Consider the scenario where a store manager likes to see the ten most recent sales in the store. This translates to Top 10 by Sale Date. In this tech tip I’m going to demonstrate a method to achieve this.
Here’s a sample report created against the e-fashion universe. The report displays the monthly sales by State and City for the year 2006 with a group against the month dimension. In this example I will be creating a Top N by Month. The same logic can be applied to Top N by Date or any numeric dimension.

What does it take to display only the last three months of the year? Here are the Steps:
Step 1: Right click at the Page header and Insert a section:

Step 2: Insert the month dimension in the Page header field and suppress the Page header b section:

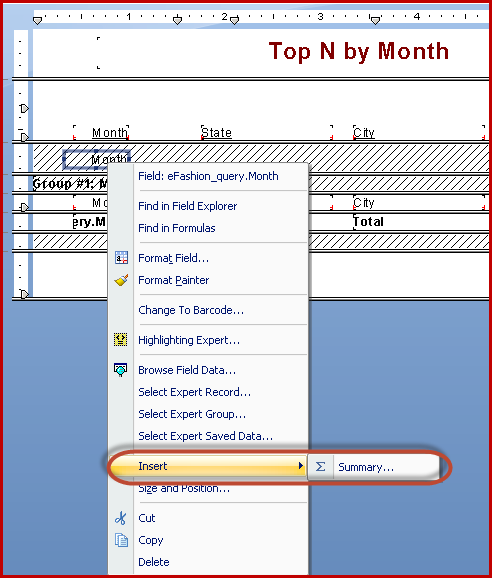
Step 3: Right click on the month in Page Header b, select Insert -> Summary:
Step 4: Select the Maximum as Summary field and display it at the group footer:

Step 5: Select Report -> Group Sort Expert

Step 6: Make the selections as shown in the screen shot below:

The last three months of data is now displayed in the report:

Some users would like the option to dynamically change it to last five months or last six months. This can be extended by creating a parameter and mapping the input value to the Top N formula.

