February 3, 2016
BusinessObjects Xcelsius
The focus of our first blog post in the UI / UX series is something called “Empty States”. This is considered very important in website and application development, but is not something you see a lot of in dashboard and BI content development. We are usually more focused on how …
Read More »
January 15, 2016
BusinessObjects Xcelsius, Products, Tech Tip, Web Intelligence Tech Tip
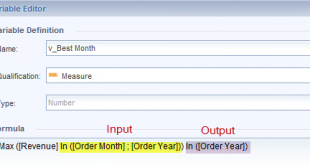
So what do you do when the report design requirements for a webi report call for customizations beyond the default aggregation? Modifying Context to Customize Web Intelligence Calculations The default aggregation in Web Intelligence provides a dynamic way to transform data on the fly. With simple drag, drop, and mouse …
Read More »
January 6, 2016
BusinessObjects Xcelsius, Events, Products
SAP BusinessObjects dashboards (aka Xcelsius) has been one of the most popular dashboarding tools for over a decade. More recently Lumira and Design Studio have been heavily promoted by SAP to BusinessObjects customers. Join us and BusinessObjects expert, Rajesh Ponnorangam, as he addresses insight into the following questions: Do Lumira …
Read More »
December 14, 2015
Business Intelligence, BusinessObjects Xcelsius, Events, iB features, News, Products, Services, Tech Tip
Although I am originally from London, UK, it has been a long time since I checked out the Christmas window displays at the major retail stores. The world famous department stores like Harrods, Selfridges and Fortnum & Mason go all out as do the elite fashion stores on Bond Street …
Read More »
November 16, 2015
BusinessObjects Xcelsius, Dashboards, Events, Products
Dashboards still dominate BI Solutions and they just seem to get better and more ingenious every year. Here is your chance to show your best BI dashboard solution and win one of the prestigious Best Dashboard Pyramid Awards and be the toast and talk of IBIS 2016. The InfoSol Dashboard Awards are …
Read More »
August 4, 2015
Business Intelligence, BusinessObjects Xcelsius, Desktop Intelligence, Web Intelligence Tech Tip
This week I was invited by an SAP BusinessObjects customer to participate in a discussion with SAP regarding whether they should use Visual Design Studio or Xcelsius to develop new dashboard based BI applications for a new project. The representatives from SAP explained the roadmap for their BI tools that …
Read More »
April 11, 2014
BusinessObjects, BusinessObjects Xcelsius, News, Tech Tip
“Create a sales report by state, by city, by store, by year, by quarter, by month…” and the list goes on. This is a very common report requirement from a business. The usual procedure for designing this report in Web Intelligence is to create different reports for each dimension or …
Read More »
January 26, 2014
Business Intelligence, BusinessObjects Xcelsius, Web Intelligence Training, Xcelsius Tech Tip
Modern Business Intelligence (BI) platforms like SAP BusinessObjects, SQL Server Reporting Services and Yellowfin BI give organizations a wealth of reporting tools. Tools like Web Intelligence, Crystal Reports and SSRS make it easy to create attractive and valuable BI reports. Getting those reports into the hands of consumers and decision …
Read More »
April 27, 2012
BusinessObjects Xcelsius, Case Studies, InfoBurst
United Educators (UE), otherwise known as “Education’s Own Insurance Company”, understands the unique risks involved with education better than anyone. It is a licensed insurance company owned and governed by more than 1,160 member colleges, universities, independent schools, public school districts, public school insurance pools, and related organizations throughout the …
Read More »
March 9, 2010
BusinessObjects, BusinessObjects Xcelsius
I recently heard a story on the radio about a farmer in England who had secretly built a castle behind a wall of haystacks so the local planning authority would not find out. He had been denied permission to build the castle but he did some research and discovered what …
Read More »
 InfoSol We're passionate about inspired business intelligence